

Article summary: The dashboard gives you, at a glance, the key figures of your activity for a day, the week and the month: confirmed bookings, cancellations, availability requests, average duration and revenue. This tutorial explains where to find it and how to read it.
The 3 key steps:
-
Open the dashboard: Statistics menu > Dashboard.
-
Choose the date: use the arrows at the top of the page.
-
Read and export: key figures on the left, breakdown by status on the right, chart export with the ☰ button.
Why follow this guide? You track your activity day by day and quickly spot a rise in cancellations or a quieter week, without running an extraction.
Open the dashboard
1. Click Statistics in the menu, then the Dashboard tile.

Read the dashboard
The page shows three periods, from top to bottom:
-
the chosen day (today by default);
-
the week containing that day, from Monday to Sunday;
-
the month containing that day.
For each period, the Key figures block shows:
-
the Number of confirmed bookings;
-
the Average duration of offers;
-
the Number of cancellations;
-
the Number of availability requests;
-
the Revenues.
On the right, the Bookings breakdown per status chart shows the share of each booking status.
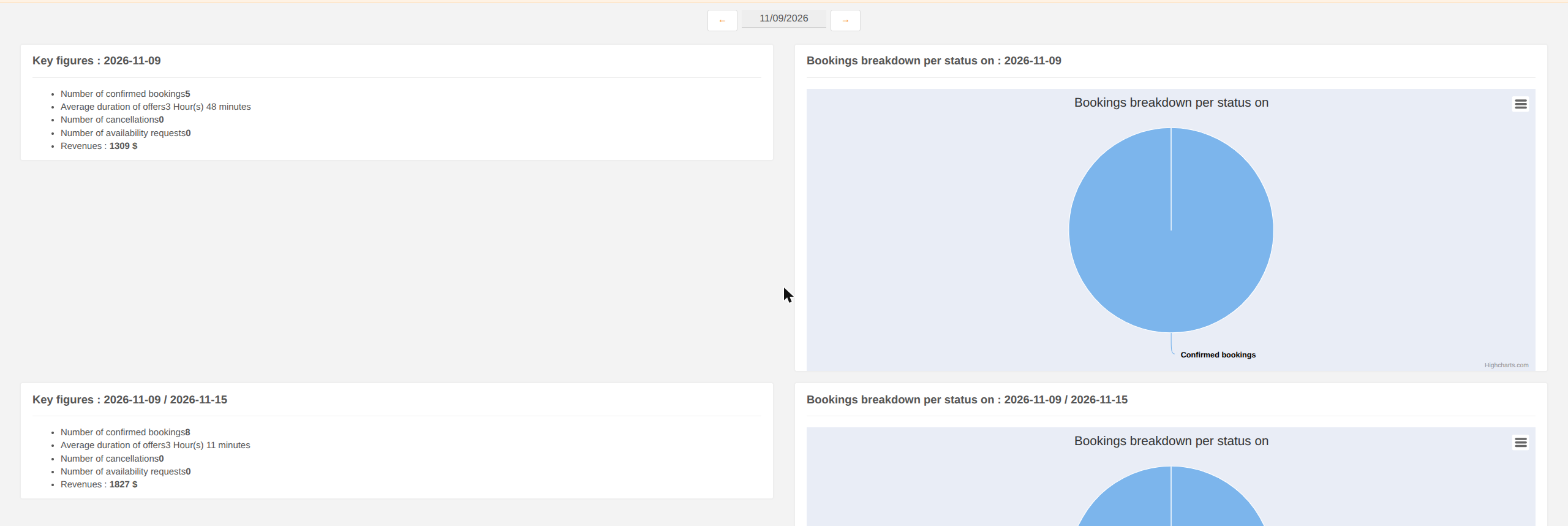
2. To see another date, click the arrows on either side of the date, at the top of the page. The three periods update.
Export a chart
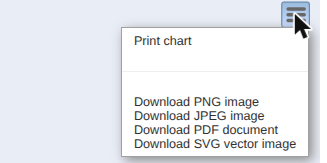
3. Click the ☰ button at the top right of a chart to print or download it (PNG, JPEG or SVG image, or PDF document).
For a detailed analysis (by activity, by customer, for any period), use Statistics > Extraction of reservations.