Article Summary: This comprehensive guide explains how to seamlessly access and analyze the summary of key performance indicators within the Reservit PMS. You will learn how to navigate your global billing statistics, apply custom date filters, and export your property's most vital financial data. Mastering this reporting dashboard ensures you can efficiently monitor daily revenue and gain actionable insights into your hotel's overall performance.
The 4 key steps to analyze your key indicators:
-
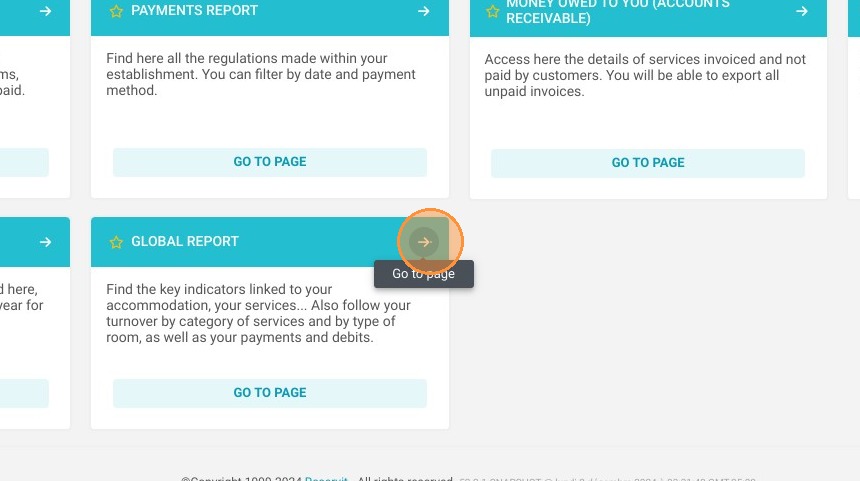
Access the Dashboard: Navigate to the "Statistics" menu, select "Billing," and click on "Global Report" to open your key indicators overview.
-
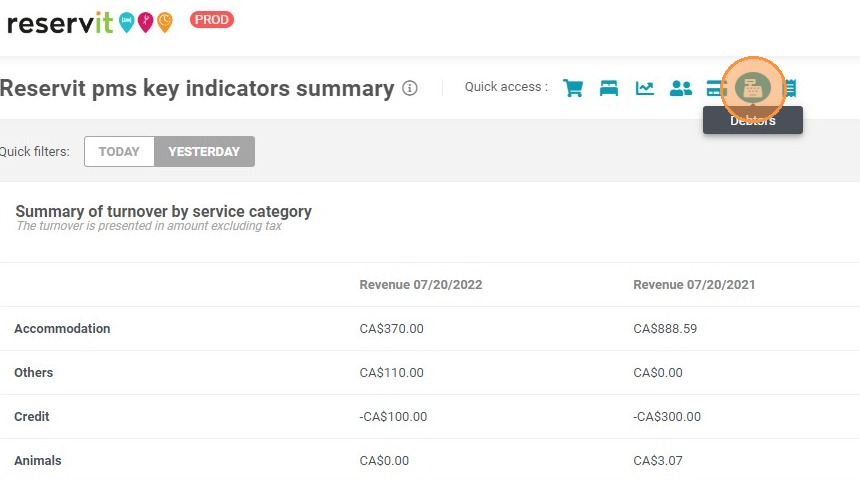
Navigate Data Sections: Use the convenient shortcuts at the top of the page to easily jump between different statistical categories and view metrics from today or yesterday.
-
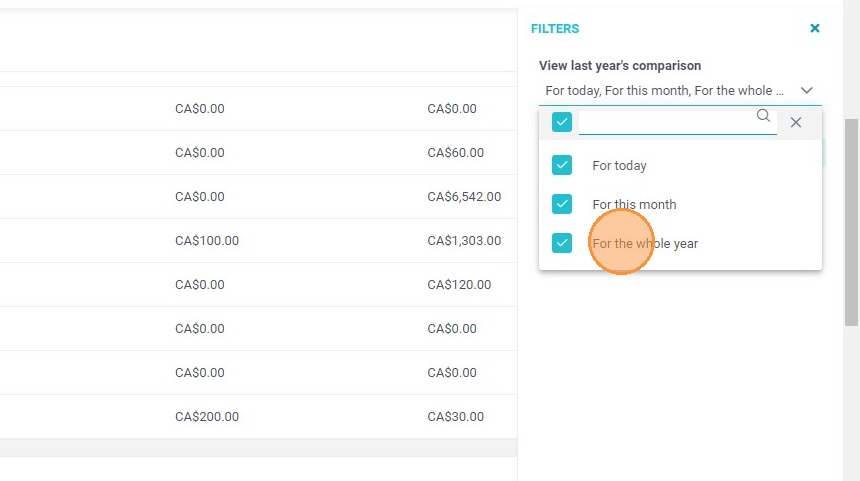
Apply Custom Filters: Click the filter tool located at the top right to select specific date ranges and customize the exact performance data displayed on your screen.
-
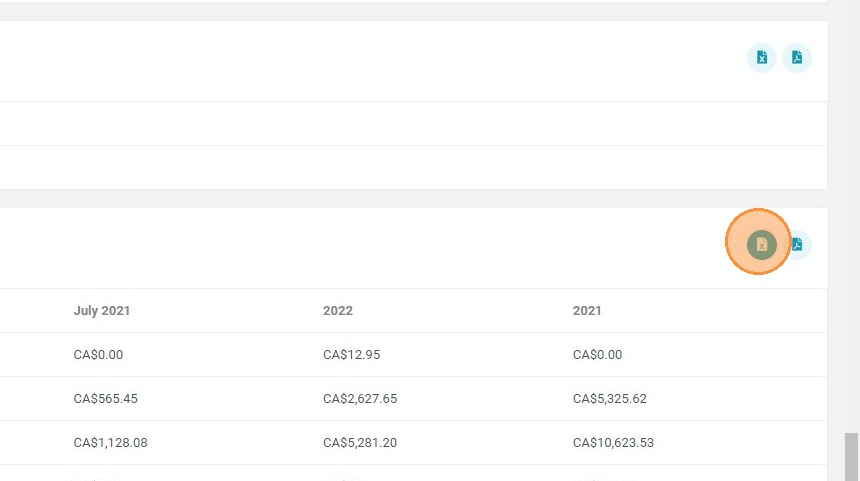
Export Your Statistics: Utilize the built-in export options within each section to securely download your key indicator data directly into Excel or PDF formats for external analysis.
Why follow this guide? Following this tutorial streamlines your daily management reporting by giving you immediate, organized access to your property's essential performance metrics. It optimizes your analytical workflows, saving your team valuable time when tracking revenue goals and preparing for operational reviews.
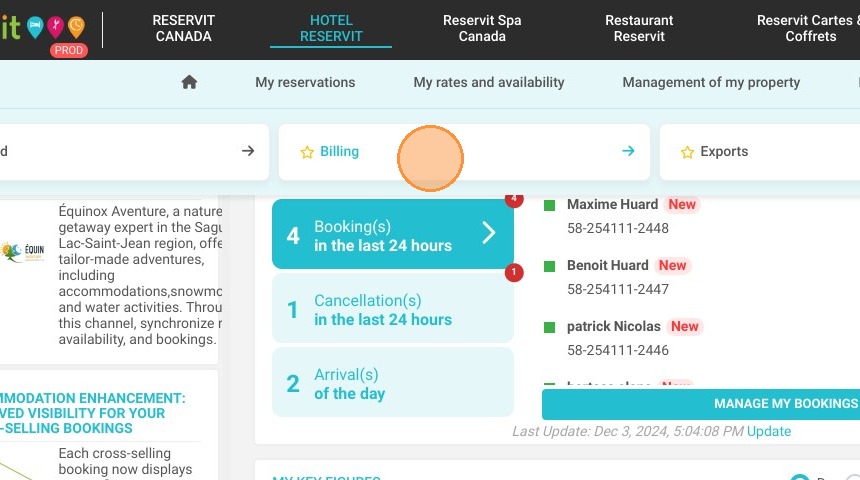
1. Click "Statistics"
2. Then ''Billing''
3. Select ''Global Report''
4. You can view the data of the day or the day before.
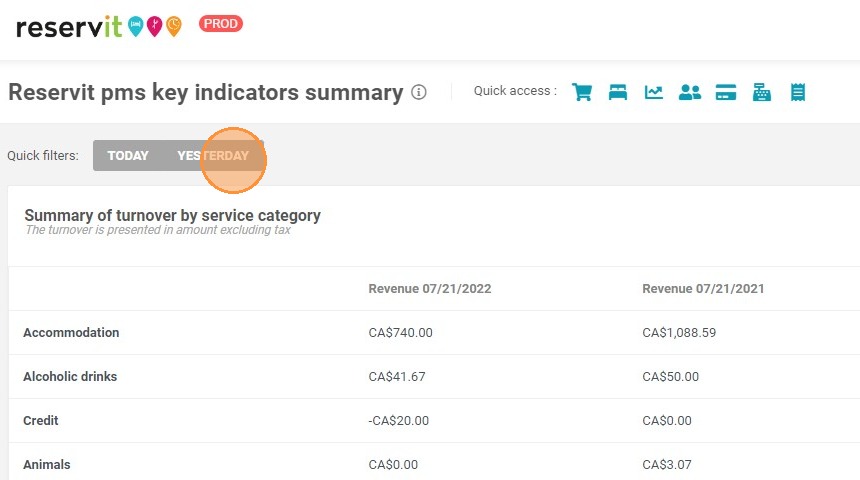
5. At the top of the page, shortcuts give you access to the different sections.
6. In each section, you can export the information in Excel or PDF format.
7. At the top right of the page, you can apply filters.
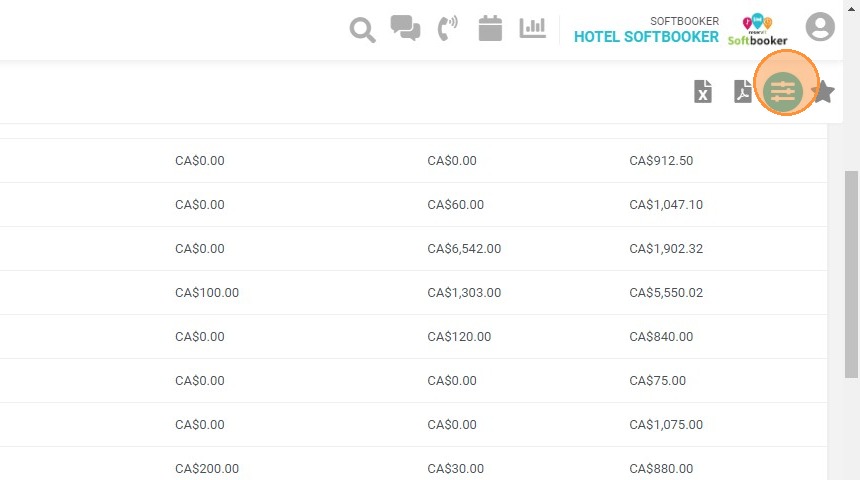
8. These filters allow you to choose the different date ranges to display with the corresponding data.