Article Summary: This tutorial explains how to easily calculate and monitor your average price per unit (also known as Average Daily Rate or ADR) using the Reservit dashboard. You will learn how to filter your financial data by specific date ranges, processing methods, and booking channels to evaluate your pricing strategy. By understanding these metrics, you can gain valuable insights into your revenue performance and make data-driven decisions to maximize your overall profitability.
The 5 key steps to track your average price per unit:
-
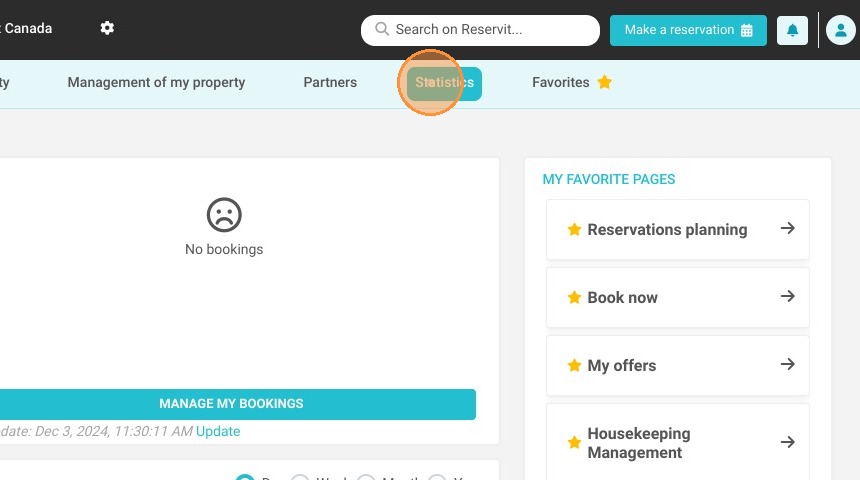
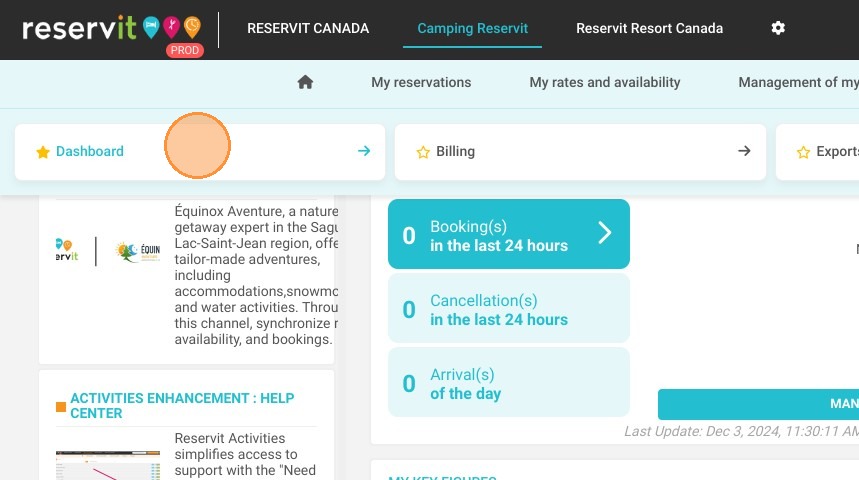
Access the Dashboard: Navigate to the "Statistics" menu and click on "Dashboard" to open your reporting interface.
-
Define the Date Range: Use the calendar tools to select the specific beginning and ending dates you wish to analyze.
-
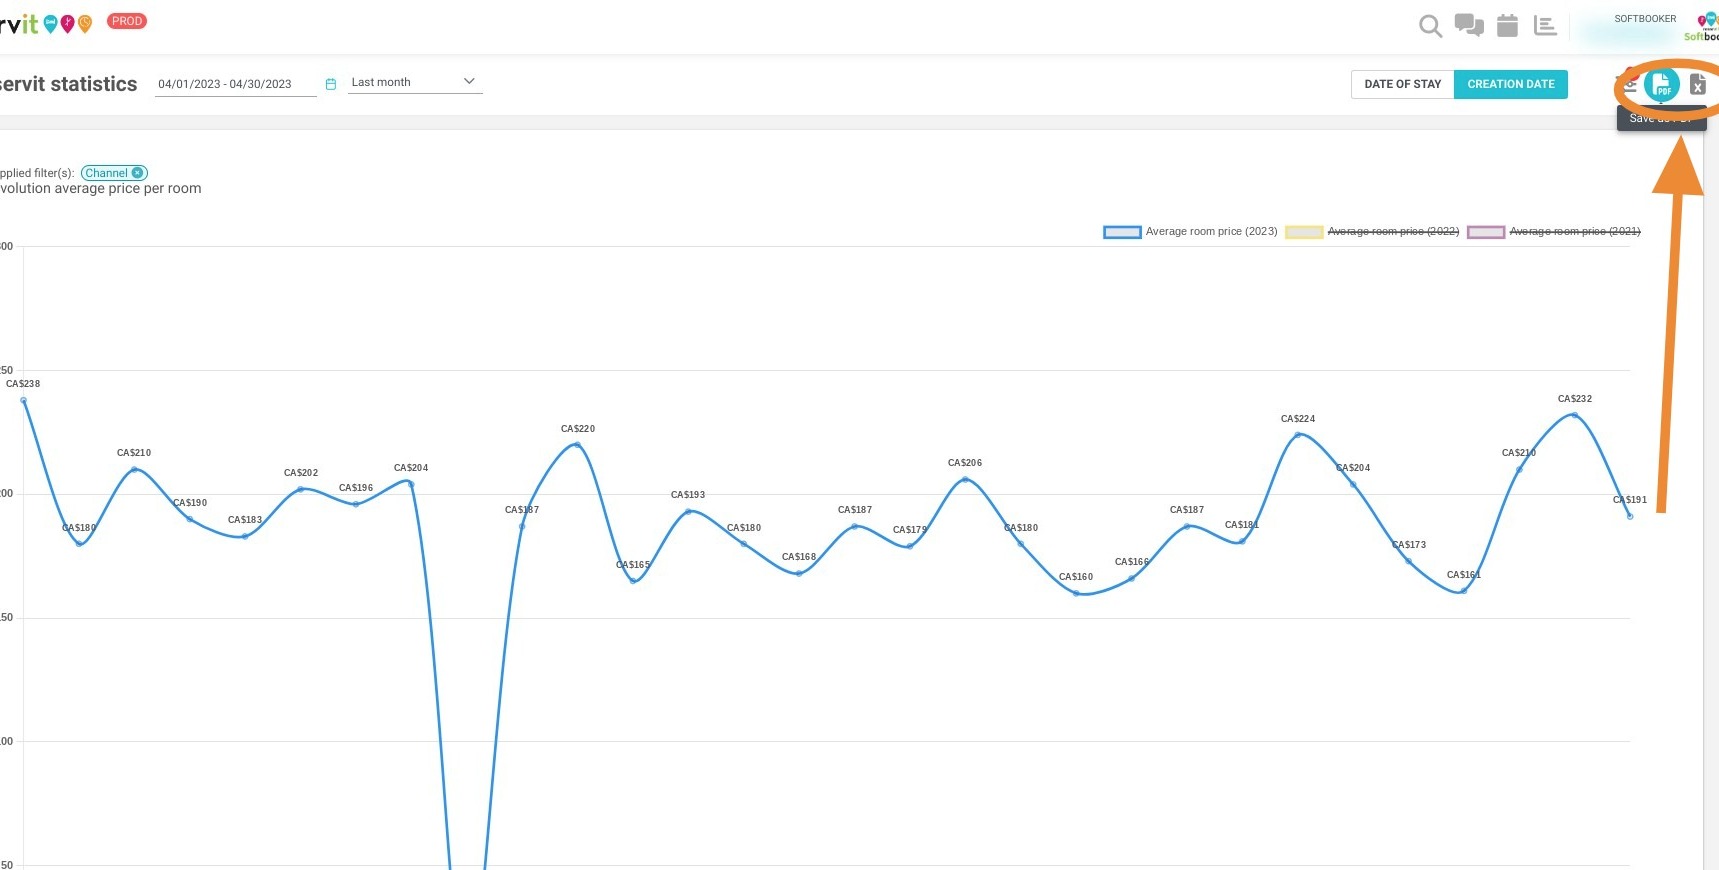
Expand and Process Data: Click to access detailed data about your price per room, then choose whether to process statistics by the booking creation date or the actual date of stay.
-
Compare and Filter Trends: Display previous years' curves to identify historical pricing trends, or use the dropdown menu to isolate the turnover related to a specific booking distributor.
-
Export Your Results: Download your comprehensive pricing statistics directly as a PDF or Excel file for secure, offline analysis and team reporting.
Why follow this guide? Consistently monitoring your average price per unit gives you immediate visibility into the effectiveness of your pricing strategy, allowing you to confidently optimize your revenue management. This guide saves you valuable time by demonstrating how to automatically extract, filter, and export these critical financial metrics, eliminating the risk of manual calculation errors.
1. Click "Statistics" then ''Dashboard''
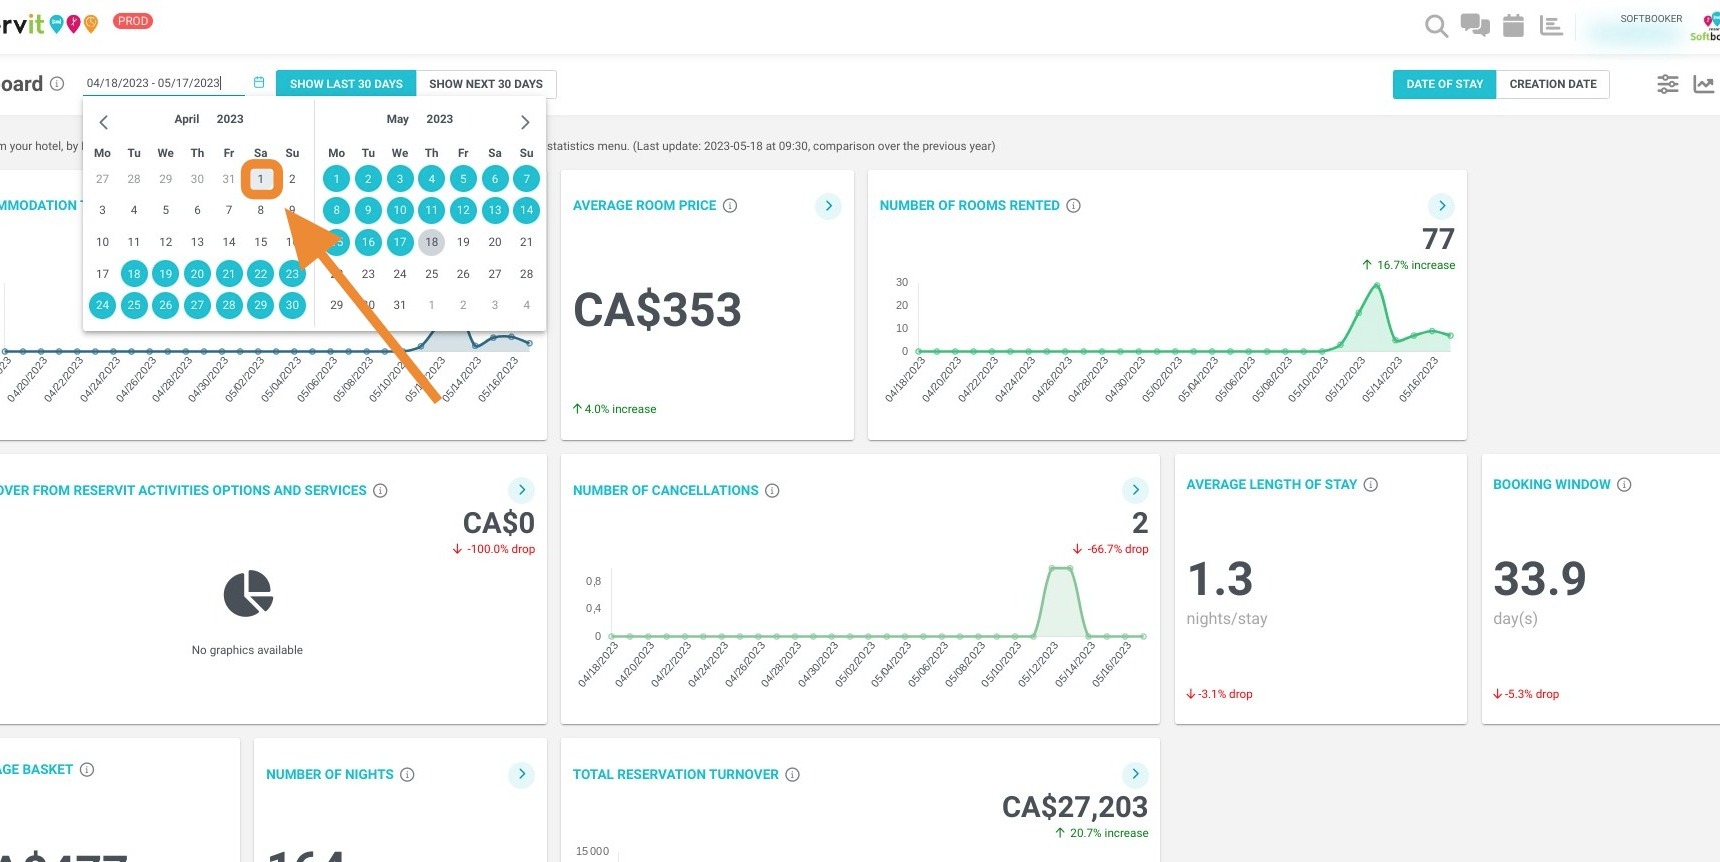
2. Then, you can select the concerned dates here :
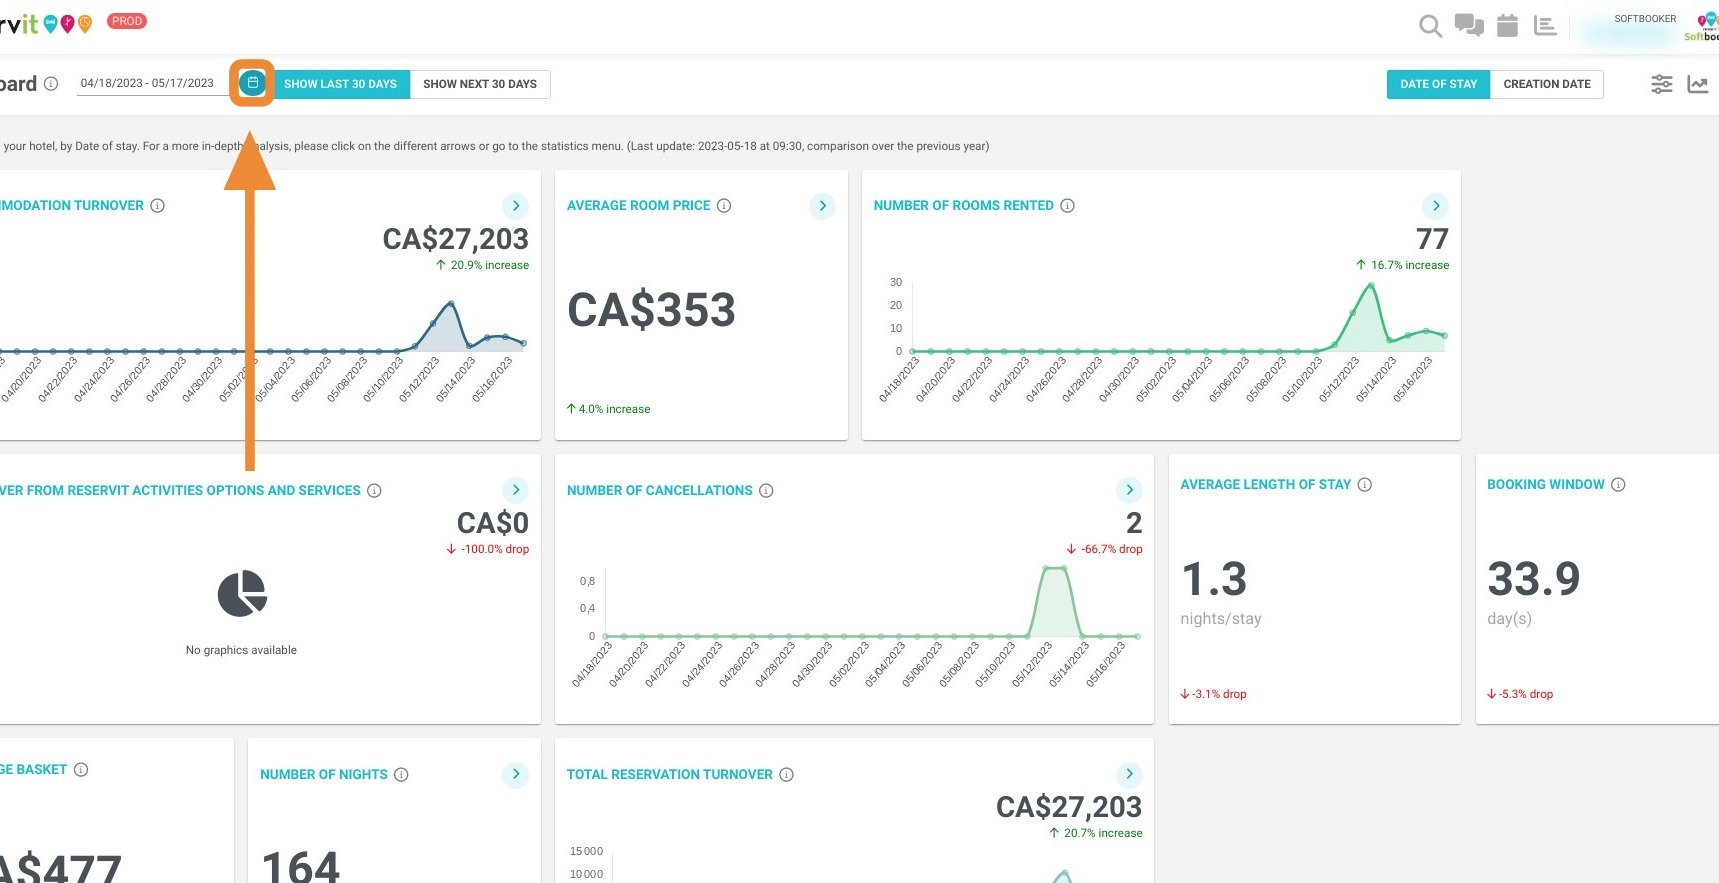
3. Beginning Date
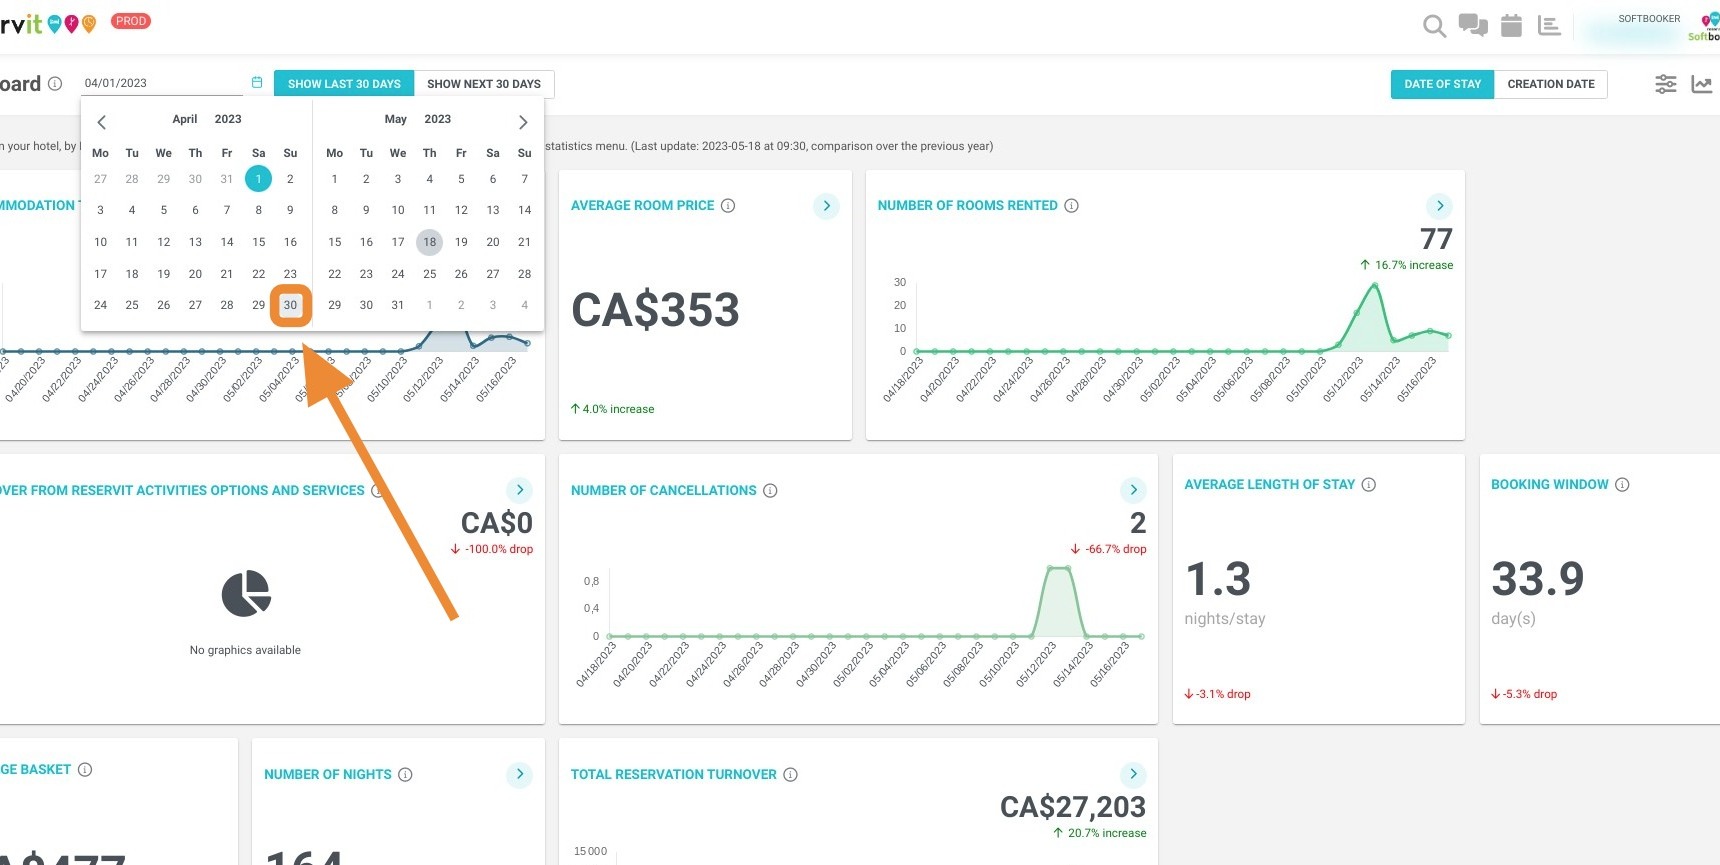
4. Ending Date
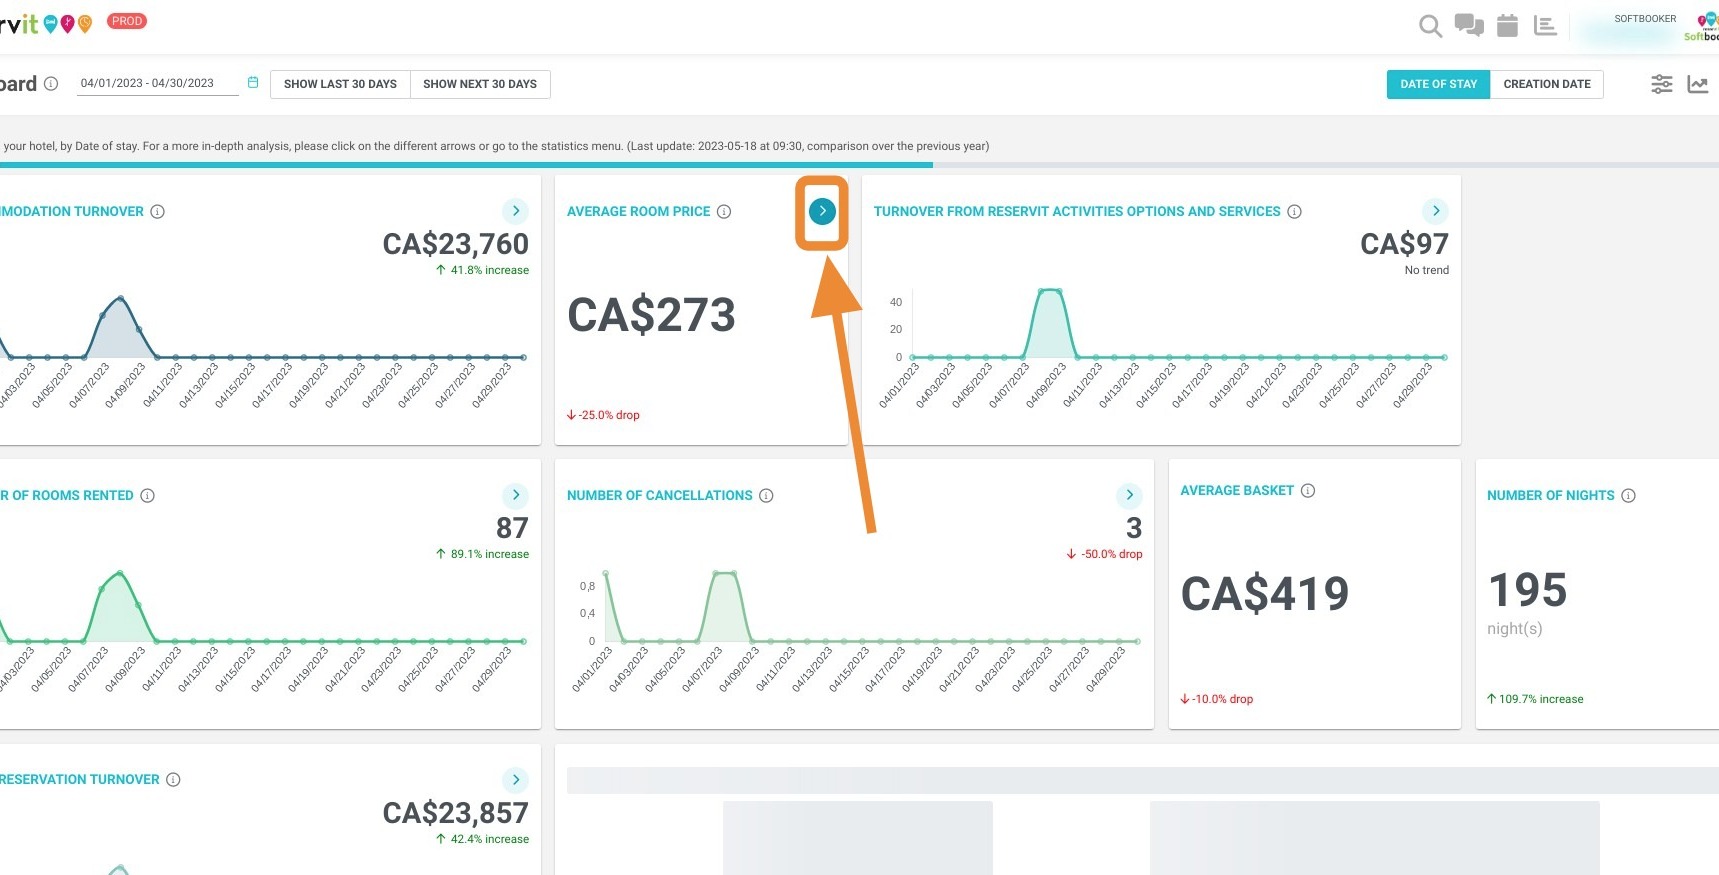
5. Click here to access more data about your price per room :
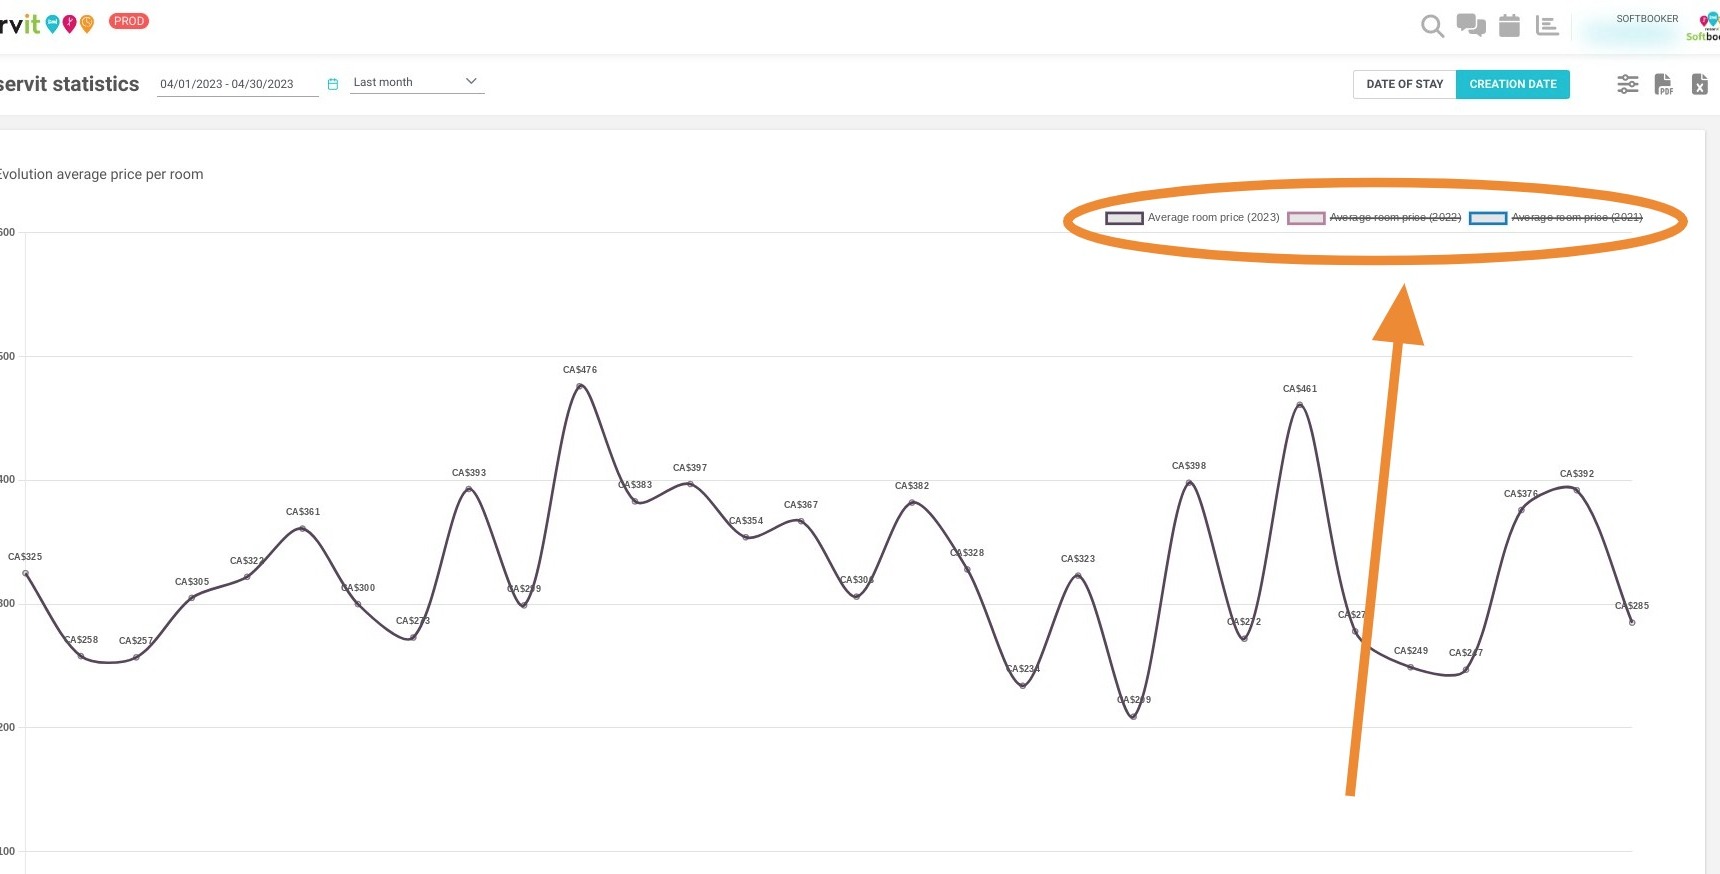
6. You can select with these two buttons, how you want to process your stats, by date of creation or date of stay of your bookings.
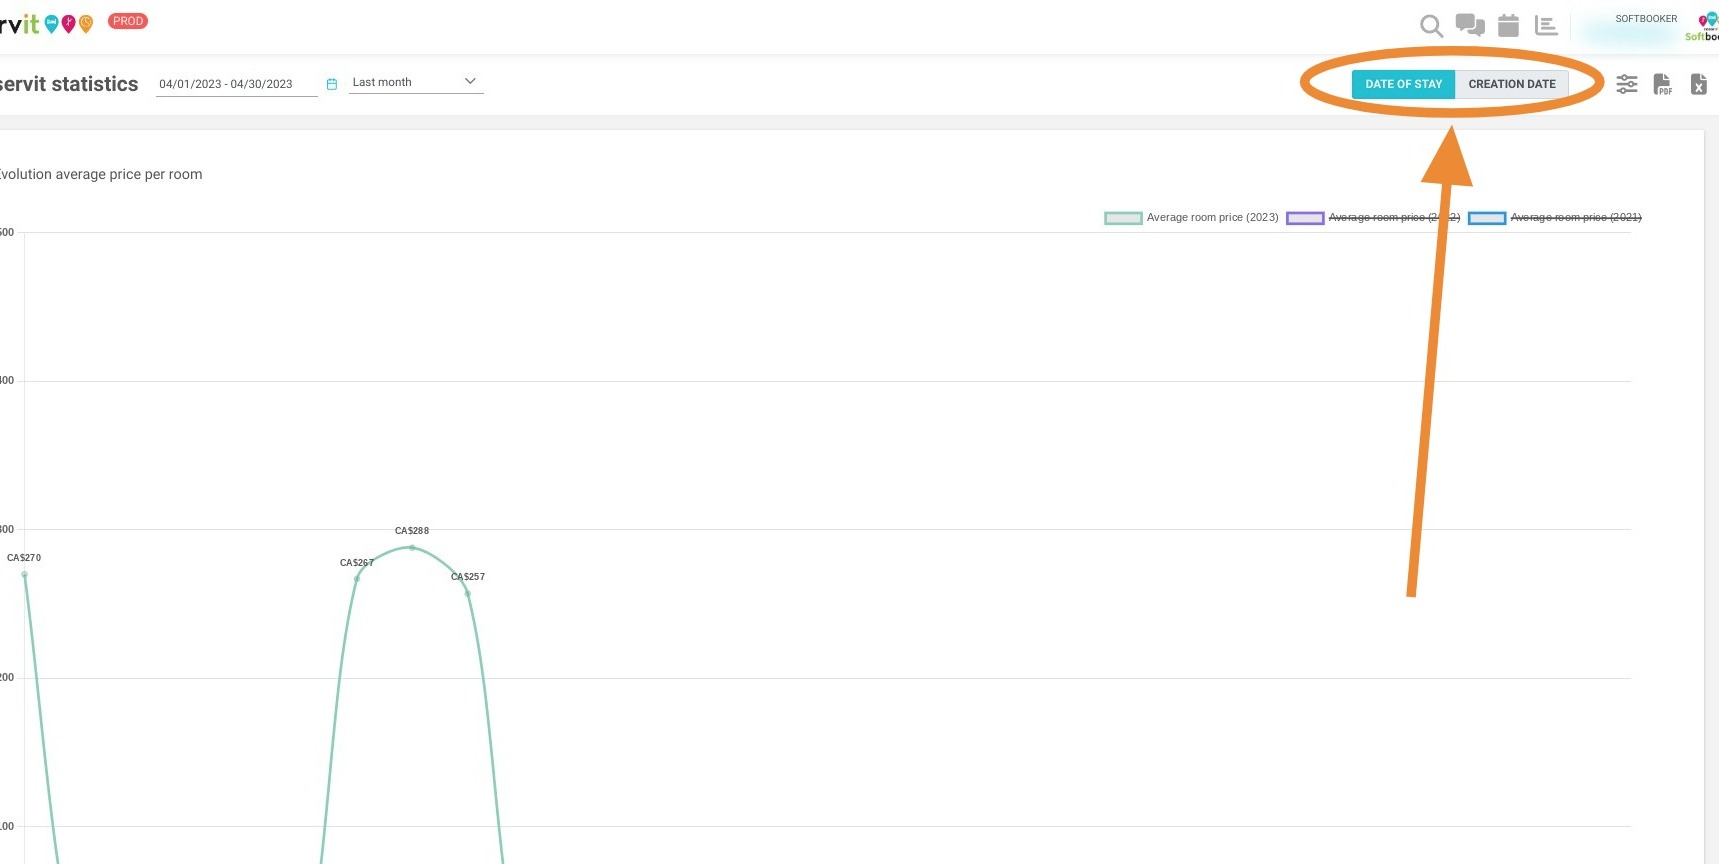
Tip: Tip ! You can display the precedent years curves.
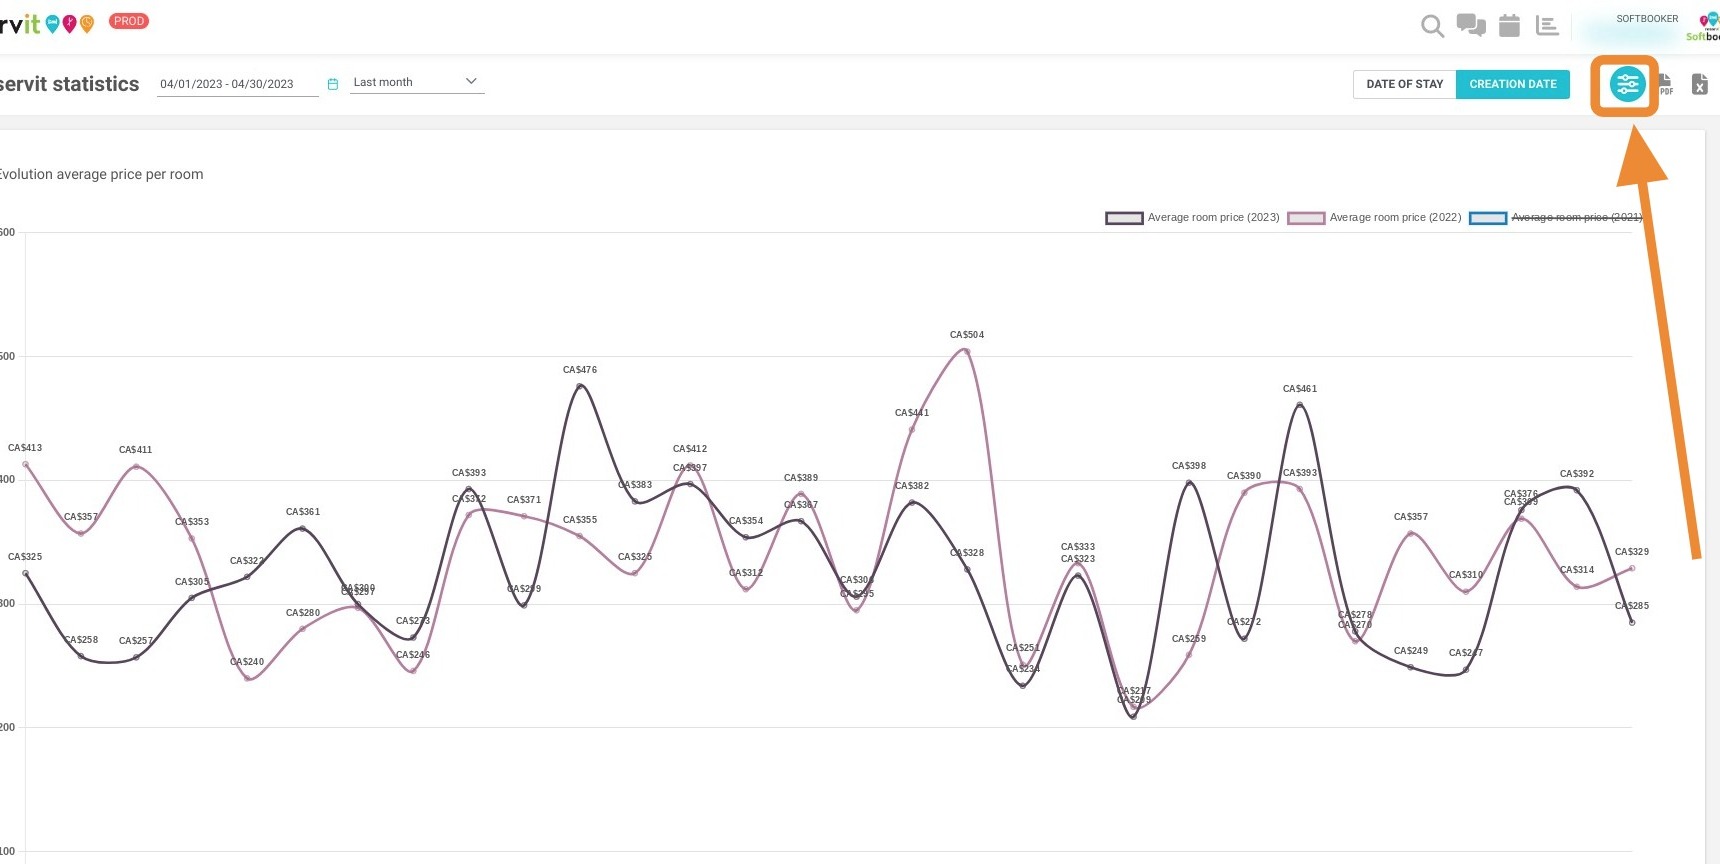
7. By clicking here :
Tip: Tip ! You can select the turnover related to a specific distributor
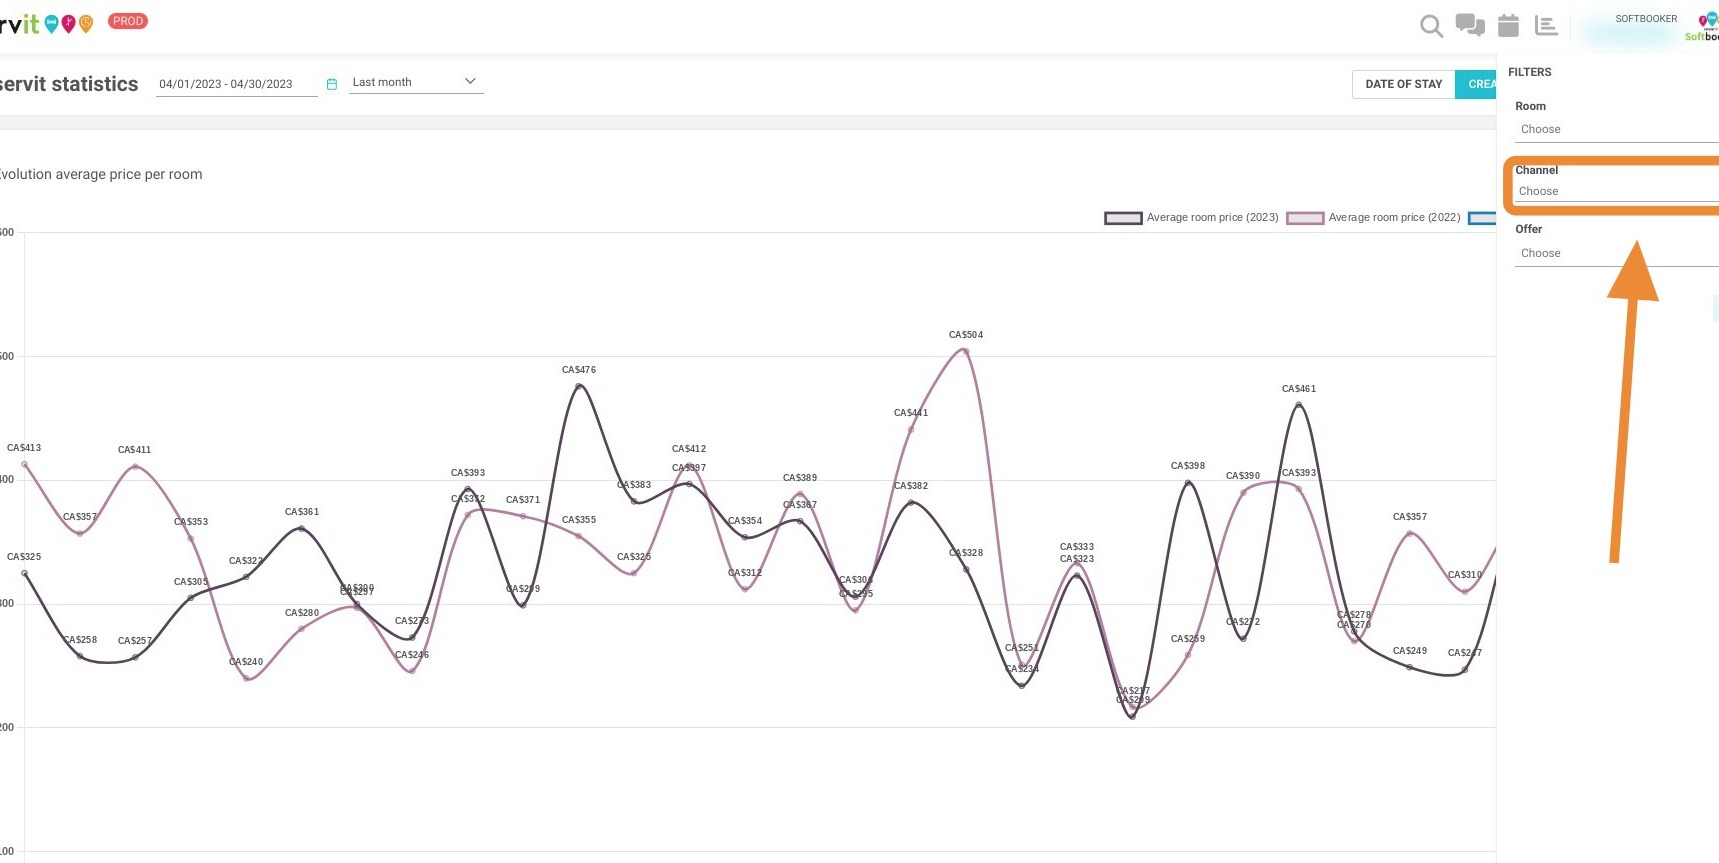
8. Click here :
9. Click "Choose"
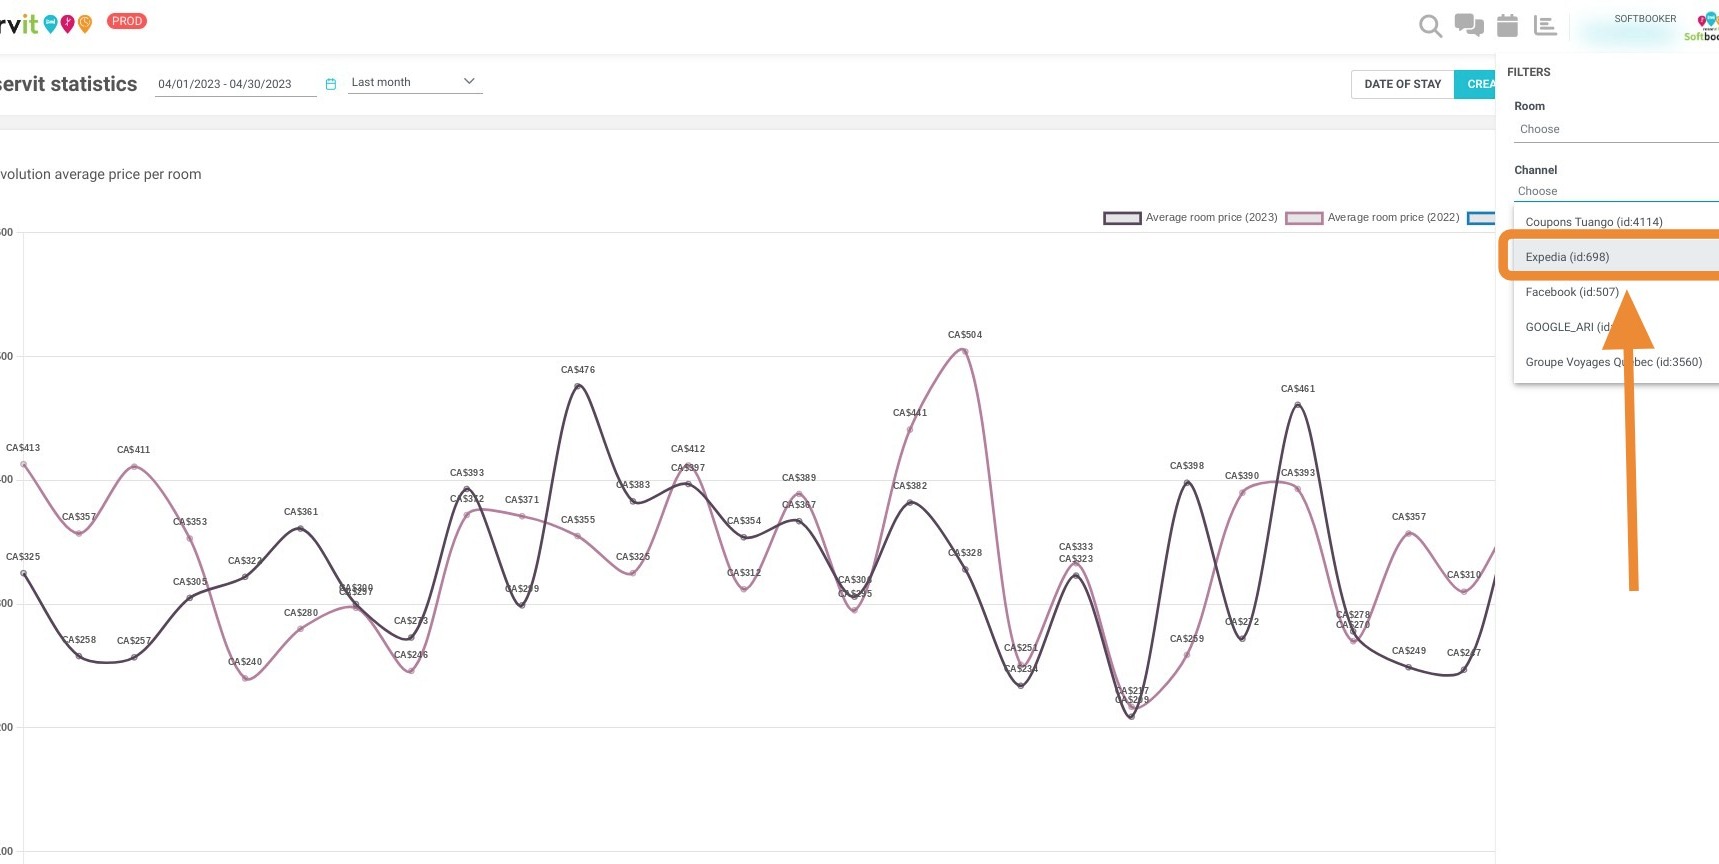
10. Click on the concerned distributor :
Tip: Tip ! You can also export your data towards PDF and Excel format :
11. Click here or here :